The Data Literacy Gap: Why 74% of Employees Feel Unprepared to Work with Data
April 25, 2026 · Framework First Academy
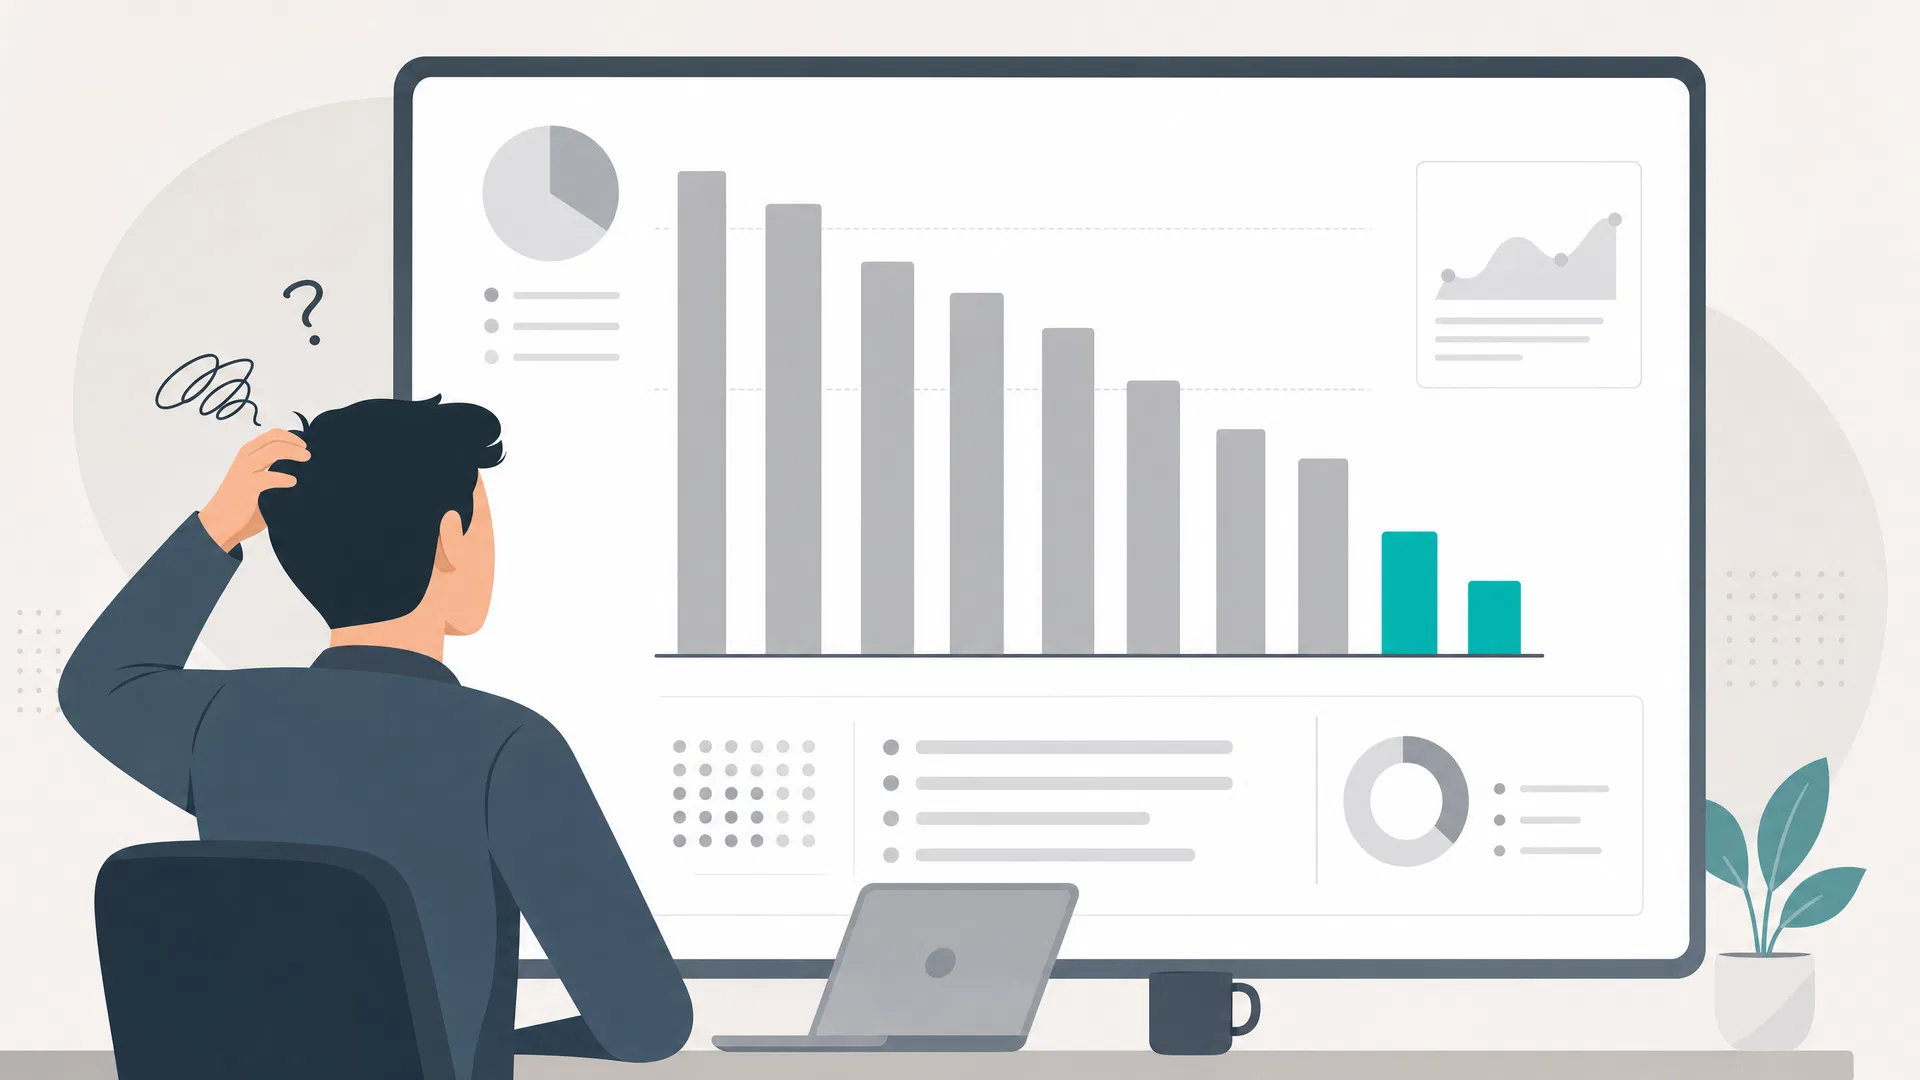
In 2020, Qlik and Accenture published a global survey of 9,000 employees and business decision-makers across 11 countries. The headline finding was striking: 74% of employees reported feeling overwhelmed or unprepared when working with data. Only 24% of business decision-makers described themselves as data-driven. And despite massive corporate investment in data infrastructure and analytics tools, the gap between data availability and data utilisation was widening rather than narrowing.
This is the data literacy gap — and it is one of the most expensive skill shortages in the modern economy.
What Data Literacy Actually Means
Data literacy is frequently misunderstood as a technical skill — the ability to use Excel, SQL, or Python to manipulate data. This misunderstanding is part of why the gap persists. Technical data skills are necessary but not sufficient. The more fundamental capability is the ability to think clearly about data: to ask the right questions, to understand what a given dataset can and cannot tell you, to identify the assumptions embedded in an analysis, and to communicate findings in ways that support good decisions.
A 2019 study by Forrester Consulting found that data-driven organisations were 58% more likely to beat their revenue goals than non-data-driven organisations. But the same study found that the primary barrier to becoming data-driven was not technology — it was the absence of the thinking skills needed to use data well.
Gartner's research on analytics adoption found that through the early 2020s, 87% of organisations had low business intelligence and analytics maturity. The bottleneck was not the tools. It was the human capacity to use the tools effectively — to ask the right questions, interpret the outputs correctly, and translate data insights into decisions.
The Three Layers of Data Literacy
A useful framework for thinking about data literacy distinguishes three layers.
The first layer is data reading: the ability to understand what a chart, table, or statistical summary is showing. This includes understanding basic statistical concepts — mean, median, variance, correlation — and the ability to identify when a visualisation is misleading or incomplete. Research by the OECD found that a significant proportion of adults in developed countries struggle with this layer, even among those with university education.
The second layer is data working: the ability to use data tools to extract, clean, and analyse data. This is the layer that most data literacy programmes focus on — and it is important. But it is not sufficient without the first and third layers.
The third layer is data thinking: the ability to frame questions in ways that data can answer, to understand the limitations of available data, to identify the assumptions embedded in an analysis, and to communicate findings in ways that support good decisions rather than just confirming existing beliefs. This is the layer where most data literacy initiatives fail — and it is the layer that produces the most value.
The Cost of Data Illiteracy
The financial cost of poor data quality and data misuse is substantial. Gartner estimated that poor data quality costs organisations an average of $12.9 million per year. IBM estimated the annual cost of bad data in the US alone at $3.1 trillion.
But these figures capture only the direct costs — the errors, the rework, the bad decisions made on the basis of incorrect data. The indirect costs — the opportunities missed because the right questions were never asked, the strategies that failed because the underlying assumptions were never tested against data — are much larger and much harder to measure.
The organisations that are closing the data literacy gap most effectively are not the ones investing the most in data tools. They are the ones investing in the thinking frameworks that allow people to use data tools well — the ability to ask precise questions, to understand what data can and cannot show, and to make decisions that are informed by evidence rather than just supported by it.
Building Data Literacy as a Framework
The most effective data literacy programmes share a common structure. They start with problem framing — teaching people to translate business questions into data questions before they touch any tool. They invest in statistical intuition — not the mathematics of statistics, but the conceptual understanding of what statistical measures mean and when they are appropriate. They practise critical reading of data visualisations — identifying misleading charts, understanding the assumptions behind common analytical approaches, and developing the habit of asking "what is this not showing me?"
This is framework thinking applied to data. The goal is not to produce data scientists. It is to produce professionals who can think clearly about evidence — who can ask good questions, evaluate the answers critically, and make decisions that are genuinely informed by data rather than merely decorated with it.
Cite this page
APA
Framework First Academy. (2026, April 25). The Data Literacy Gap: Why 74% of Employees Feel Unprepared to Work with Data. Framework First Academy. https://www.frameworkfirst.site/blog/data-literacy-gap-most-expensive-skill-shortage
BibTeX
@misc{ffa-2026,
  author = {Framework First Academy},
  title = {The Data Literacy Gap: Why 74% of Employees Feel Unprepared to Work with Data},
  year = {2026},
  howpublished = {\url{https://www.frameworkfirst.site/blog/data-literacy-gap-most-expensive-skill-shortage}},
  note = {Accessed: 2026-09-09}
}Learn the framework behind the article
30 courses. Four stages. Every one starts with the situation, not the syllabus.
Explore coursesKeep reading
DMAIC vs PDCA: Which One Do You Reach For? (With a Decision Table That Actually Decides)
DMAIC or PDCA? This in-depth guide breaks down the key differences, a side-by-side comparison, and a practical decision table to help you choose the right process improvement framework for your situation — with four real-world scenarios.
Python vs Excel for Data Analysis: A Framework Decision Guide
Python vs Excel for data analysis — a structured decision framework to help analysts choose the right tool based on dataset size, complexity, automation needs, and career trajectory.
Lean Six Sigma vs Six Sigma: Differences & When to Use Each
Understand the key differences between Lean Six Sigma and Six Sigma, when to use each, and how to choose the right roadmap for your process improvement goals.